How to use
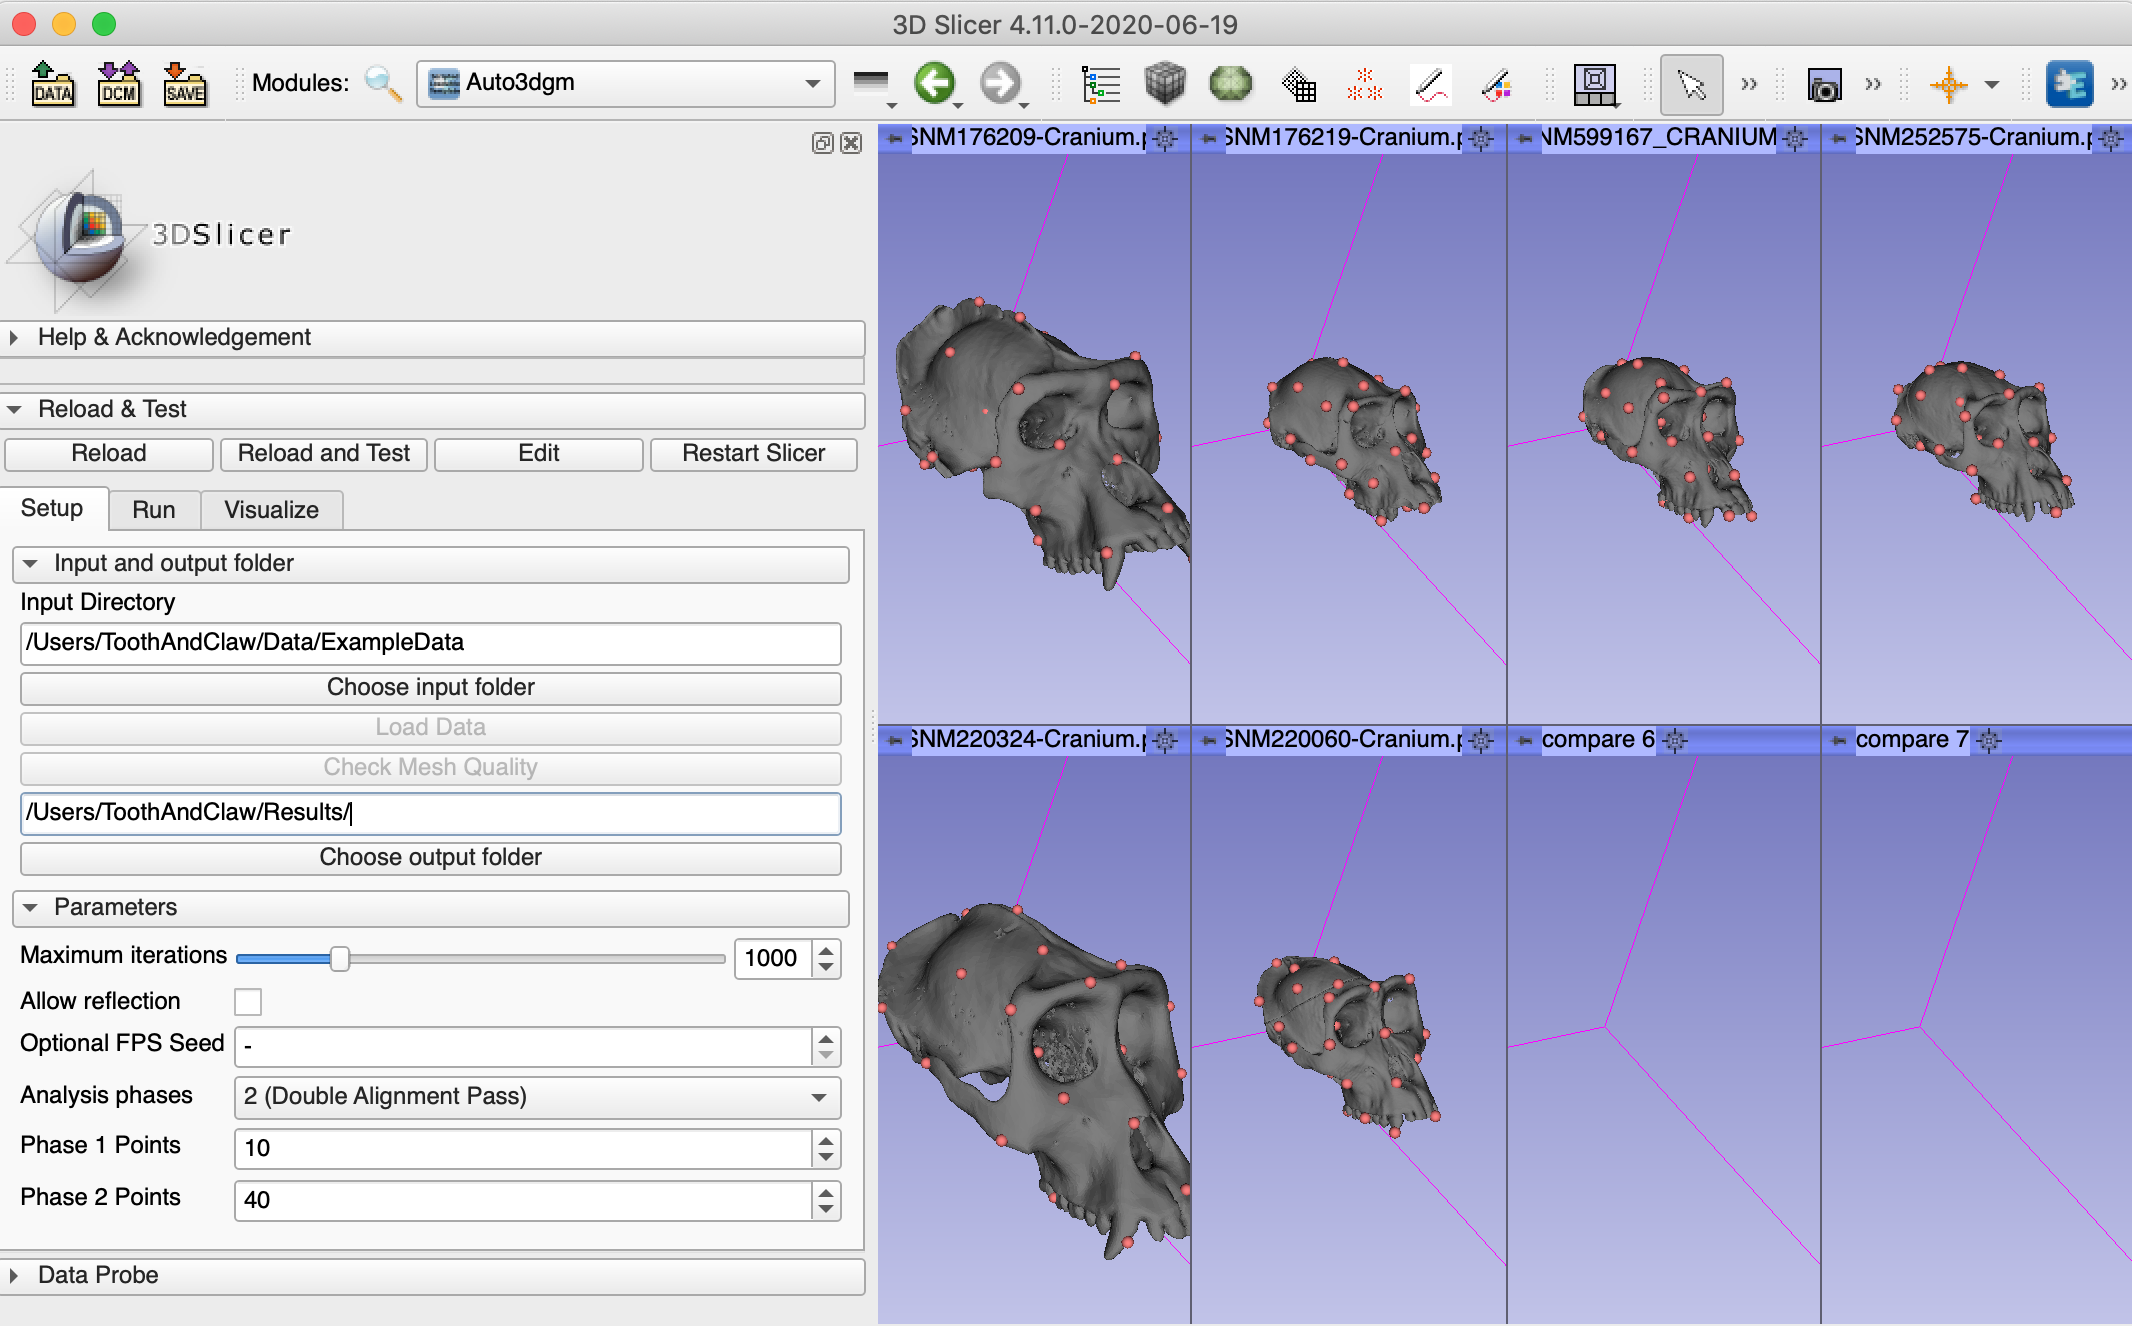
1. Auto3dgm UI in Slicer
The auto3dgm UI consists of three components:
- setup: load data and specify parameters used in the auto3dgm algorithm
- run: subsample and align the data
- visualize: the aligned data in a pop-up window

2. Download example data and load data in Slicer
Download example data from https://bit.ly/ExampleData
In the setup tab, specify
input folder: location where you saved the example data set
e.g., /Users/ToothAndClaw/Data/ExampleData
output folder: location where you want to save the aligned data and the pseudolandmarks
e.g., /Users/ToothAndClaw/Results/
Then click on Load Data.
Next, click on Check Mesh Quality, which finds if there is any NaN-valued vertex in the mesh. If the quality check failed, make sure the data is cleaned before you proceed to the next step.

3. Set up parameters
Auto3dgm uses a two-phase analysis for shape alignment. The algorithm first subsamples two sets of pseudolandmarks for each shape, and then aligns the subsampled points. In the algorithm, we will need to specify how many points we will subsample in each phase. The default is set to be 10 points for phase 1 and 40 points for phase 2. In general, a few hundred points will give pretty good shape alignment. The more points we use, the better the results.
There are some other parameters in the auto3dgm UI. In general, you can leave them as they are.
- Maximum iterations: the max number of alignment
- Allow reflection: if selected, mirror reflection will be allowed to optimize alignment.
- Optional FPS seed: specify the first point to be selected in FPS. If not specified, the algorithm will use the first one.
4. Run auto3dgm
In the run tab, you can either run the entire analysis or run each step separately. Here you can simply click “run all steps”. The aligned meshes (in .ply format) and the registered pseudolandmarks (in .fcsv files) will be saved in the specified output folder.
This process may take a few minutes.
5. Visualize aligned data
The visualize tab allows you to see how the aligned meshes and the registered landmarks look like.
You can select either visualize phase 1 alignment or visualize phase 2 alignment.
Rotate or rescale the displayed meshes by moving your cursor.

6. Output
The output of each phase (1 and 2) contains four components.
- aligned (pseudo)landmarks (.fcsv files)
- aligned meshes (.ply files)
- rotation (.csv and .h5 files)
- scale info (.csv and .h5 files)
- registered landmarks in original subject space (OSS) (.fcsv files)
Here are some examples on how to use the Auto3dgm output:
- Statistical shape analysis with Auto3dgm landmarks
Use the GPA module in the SlicerMorph extension on aligned_landmarks or landmarks_OSS for computing mean shape and principal component analyis. Watch this video to learn how to use the GPA module.
- Transformation
Use the .h5 files in rotation and scale_info folders to transfrom between the original subject space and the aligned uniformized space.
